On a recent project near the Bow River in downtown Calgary, we faced a 30-story tower where conventional boreholes alone couldn't resolve a suspected paleochannel cutting through the gravels. The client needed to know if the channel was sand-filled or clay-filled — two radically different stiffness profiles. We deployed seismic tomography (refraction and reflection) along two 120-meter lines, shooting 48 geophones with a 4.5 Hz natural frequency and a 10-kg sledge source. The tomographic inversion revealed a 6-meter-deep clay-filled trough that boreholes had missed entirely. That kind of detail is what makes seismic tomography indispensable for Calgary's complex glacial stratigraphy — it gives you a continuous velocity model rather than isolated point data. For projects where lateral variability is the main risk, combining this with a resistivity survey helps distinguish saturated sands from clays, and we often pair it with [MASW](/masw-vs30/) when shear-wave velocity profiles are needed for site class definition under NBCC 2020.
Seismic tomography revealed a 6-meter clay-filled trough in downtown Calgary that boreholes missed entirely — a finding that changed the foundation solution.
Methodology and scope
A common mistake we see among Calgary developers is relying solely on boreholes for seismic site classification, especially in areas like the Paskapoo Formation where sandstone and claystone interbeds change every few meters. Seismic tomography fills that gap by delivering a 2D P-wave velocity field that picks up velocity inversions — for example, a soft clay lens sitting inside a stiffer till. The refraction component maps the top-of-bedrock and any velocity layering, while the reflection component images dipping strata and fault offsets that refraction alone would smooth out. In our Calgary projects, we typically use 24 to 48 channels with 2-meter geophone spacing for shallow engineering targets down to 40 meters. When we need to correlate velocity anomalies with actual soil types, we always integrate the tomography with calicatas exploratorias for direct visual logging, and for liquefaction screening in the finer-grained deposits we cross-reference with SPT blow counts to calibrate the velocity-to-resistance relationship.
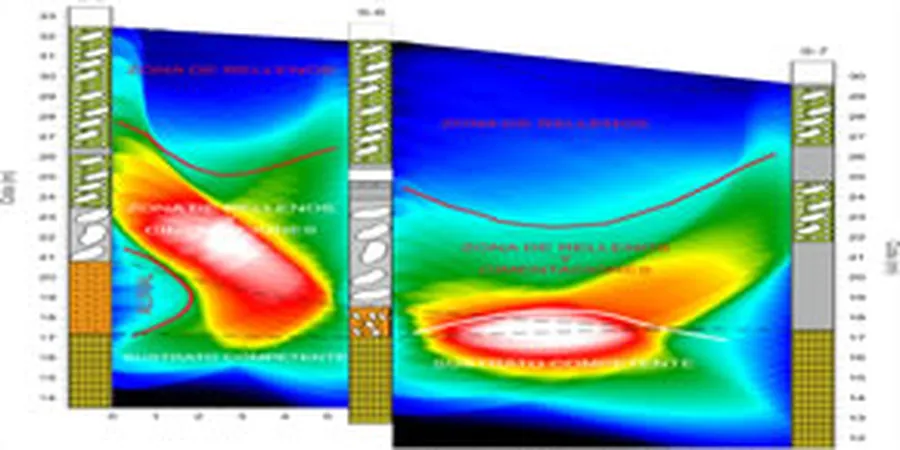
Technical reference image — Calgary
Local considerations
Calgary sits at 1,045 meters above sea level within the seismic hazard zone defined by NBCC 2020 for the Rockies foothills, where peak ground acceleration can reach 0.32g for some site classes. The city's legacy of glacial till over bedrock means shallow velocity contrasts of 50% or more are common — a classic setup for seismic wave amplification if you don't map the stratigraphy correctly. In our experience, a single boring in a till sheet can report 30 blows per foot and give a false sense of uniformity, while the adjacent shear zone in the underlying sandstone yields 8 blows per foot. That lateral change is exactly what seismic tomography images. Ignoring it means foundation designs may underestimate differential settlement or overestimate the bearing capacity of the till cap. We've seen projects where the velocity model directly saved the client from over-excavating 2 meters of what looked like soft material but was actually a dense, dry sand with high modulus.
ASTM D5777-18 for refraction, ASTM D7128-18 for reflection
Associated technical services
01
Shallow Refraction Tomography (0-40 m depth)
For foundation investigations, pipeline routing, and pavement subgrade evaluation. Uses 24 geophones with 2-5 m spacing, hammer or weight-drop source, and outputs a 2D velocity model with 0.5 m pixel resolution. Ideal for mapping top-of-bedrock, gravel lenses, and soft zones in till.
02
Deep Reflection Tomography (20-80 m depth)
For large infrastructure projects like bridge abutments, tunnels, and high-rise towers. Uses 48 geophones with 2-3 m spacing and a larger energy source (accelerated weight drop or minibang). Resolves dipping strata, fault offsets, and buried channels in the Paskapoo and Porcupine Hills formations.
03
Integrated MASW + Refraction Tomography
Combines P-wave refraction tomography with multichannel analysis of surface waves (MASW) to derive both Vp and Vs profiles. The Vs data feeds directly into NBCC 2020 site class calculations (A through F), while the Vp model identifies lithological boundaries. We deliver a combined report with interpreted cross-sections and velocity contours.
Applicable standards
ASTM D5777-18 (Standard Guide for Refraction Seismic Methods), ASTM D7128-18 (Standard Guide for Reflection Seismic Methods), NBCC 2020 Seismic Hazard Calculations for Calgary (Site Class A to F), CSA A23.3-19 (Design of Concrete Structures — seismic provisions)
Frequently asked questions
How deep can seismic tomography see in Calgary's glacial till and sandstone?
In typical Calgary conditions with 24 to 48 geophones and a sledgehammer source, we achieve reliable velocity models down to 40 meters for refraction and up to 80 meters for reflection. The depth depends on the energy source — for deeper targets (60+ m), we use an accelerated weight drop or a small explosive charge (permitted under Alberta's Explosives Act). The Paskapoo sandstone, with its relatively high seismic velocity (2,500-3,500 m/s), actually helps because the velocity contrast with the overlying till (1,500-2,200 m/s) is strong enough to generate clear refractions.
What is the difference between refraction and reflection seismic tomography?
Refraction tomography uses first-arrival travel times of P-waves that have been bent (refracted) through higher-velocity layers. It produces a smooth velocity model that is excellent for mapping layer boundaries and velocity inversions, but it tends to smear sharp interfaces. Reflection tomography, on the other hand, uses the reflected wavefield from subsurface interfaces — think of it as an ultrasound for the ground. It images dipping strata, faults, and pinch-outs with higher spatial resolution, but requires a larger source and more geophones. For most Calgary engineering projects, we run both simultaneously: refraction for the velocity structure (used for stiffness and modulus estimates) and reflection for the structural geometry.
What is the typical cost range for seismic tomography in Calgary?
For a standard 120-meter line with 24 geophones, hammer source, and a full tomographic inversion report, the cost typically falls between CA$4,140 and CA$8,070. This includes mobilization within Calgary city limits, data acquisition, processing, and a interpreted cross-section showing P-wave velocities and interpreted geology. Larger arrays (48 channels, weight-drop source) or projects requiring multiple lines will be on the higher end. We provide a firm fixed-price quote after reviewing the site plan and target depth.